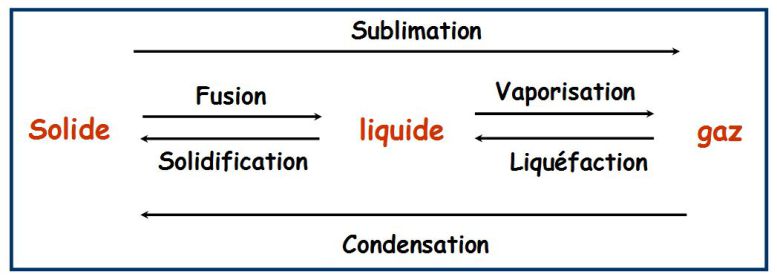
State changes of pure substances
Fondamental : A little vocabulary
The condensed state : solid state and liquid sate.
The fluid state : the liquid state and gaseous state.
Complément : Some videos about state changes of pure substances
Fondamental : Equilibrium Conditions
It symbolizes the equilibrium between phases by :

This is a reversible equilibrium, which occurs at constant
 and
and
 .
.
For example, for water, the melting temperature is
 and the vaporization temperature is
 , for a pressure of
 .
.
At the top of Mont-Blanc, the pressure is of the order of
 .
.
The melting temperature does not vary and the vaporization temperature becomes
 .
.
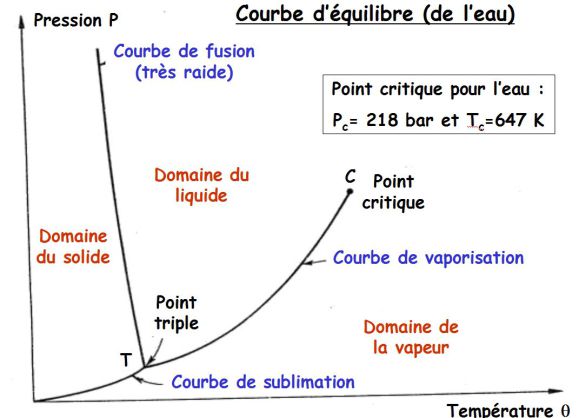
The equilibrium curve shows the temperatures and pressures to which the state changes occur.
Previous curve gives the equilibrium curve of water (melting curve of negative slope).
For all other substances, the melting curve has a positive slope.
A video about critical point :
The critical point is the end point of a phase equilibrium curve.
The most prominent example is the liquid-vapor critical point, the end point of the pressure-temperature curve that designates conditions under which a liquid and its vapor can coexist.
At the critical point, defined by a critical temperature
 and a critical pressure
 , phase boundaries vanish.
The following illustration shows the principle of freeze orange juice.
The liquid orange juice is cooled at constant pressure and becomes solid.
At the constant temperature, pressure is then reduced through sublimation.

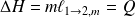
Fondamental : Enthalpy of state changes
Consider the reversible phase change, which is carried out at determined
and
(
 is given by the equilibrium curve) :
Called specific enthalpy change of state the quantity :

At constant pressure (it is the case here),
 is interpreted as the heat necessary to provide when changing states :

Examples :

Remarks :

If
 is the initial mass of phase
 , then :
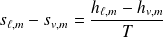
Méthode : Changes of state functions
Consider the equilibrium :
So :


Fondamental : The study of liquid-vapor equilibrium
Saturation vapor pressure :
If we introduce a pure liquid in a vacuum closed container (sufficient quantity), the liquid is partially vaporized.
This vaporization is stopped when the pressure above the liquid (pressure of the gas phase) reaches a certain value, called "saturated vapor pressure", given by the vaporization curve.
This pressure
 depends only on the temperature.
Example (for water) :
|
|
|
|
|
|
|
|
|
|


Evaporation and Boiling :
Evaporation : if the previous container is opened, the saturation vapor pressure can not be reached (regardless of the amount of liquid) ; all the liquid evaporates.
Boiling : a liquid begins to boil when the saturated vapor pressure at the relevant temperature
is equal to the pressure
that supports the liquid.Vapor pressure is sufficient to cause vapor bubbles formed within the liquid.
For water :

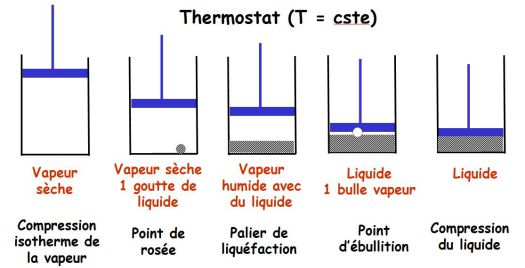
Saturation curve, Andrews isotherms :
One compress dry isothermal vapor which is contained in a cylinder closed by a piston.
This builds the saturation curve (in the Clapeyron plan (
 )).
)).
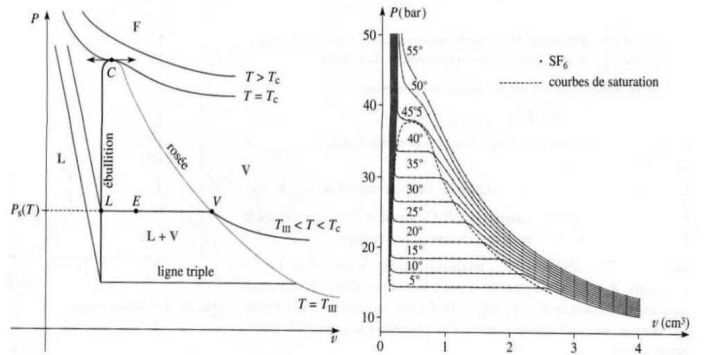
It traces a network of Andrews isotherms, consisting of curves giving, for a given temperature, the evolution of the pressure of the gas trapped in the cylinder in terms of the volume it occupies.
The saturation curve and the critical isotherm delimit in the Clapeyron diagram, four different areas : the liquid state, the gas state, gas-liquid two-phases state and a fluid state where one can not indicate that the fluid is in the liquid or gaseous state any more.
Fondamental : State Functions of two-phase system
Note
 and
and
 the liquid and vapor masses on the state change bearing (two-phases system).
Either :

The total mass of the two-phases system.
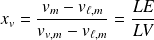
And :
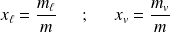
respectively the mass titles in liquid and in vapor of two-phases system.
Obviously we have :

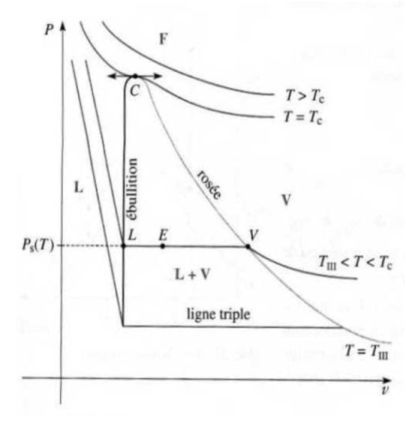
Theorem "moments" :
 and
and
 are the volume mass densities of liquid and steam and the total volume mass density occupied by the two-phases system :
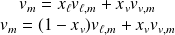
We can deduce :
Two-phases system functions :
With obvious notations :

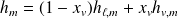


For the system of mass
:

Some relations between these quantities :
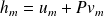
And :